Display (Interpretation)

Great displays make great reports. Discover how to take your interpretation displays to new Insights!

|
3D View: Draping Culture and Contours
Build a stunning digital elevation model with DUG-Insight’s 3D view upgrade!
Drape any image directly over structure! Boost your planning by utlising all your resources,
add aerial photography, political boundaries and even detailed contours directly in the 3D Viewer.
|
|

|
Stratigraphic flattening
Need a better way to evaluate your depositional environment? Looking for a good method to slice through channel sands? Insight's stratigraphic flattener might be the tool for you! Fast, dynamic views are calculated on-the-fly and can be applied to 2D or 3D seismic and even pre-stack gathers!
|
|

|
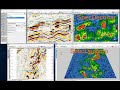
Structural Contours over Amplitudes
Overlaying structure contours on a horizon property map is a great way to show amplitude conformance, thickness variation, or other properties in relation to structure. In this example, a windowed RMS amplitude map is displayed with structure contours overlaid.
|
|

|
Isopachs, Isochores and Isochrons
Generating isopach and isochore maps in DUG Insight is quick and easy. Find out how to get the right thickness for your interval using this handy workflow! Click to find out more.
|
|

|
Working with Culture
Knock up impressive displays using DUG Insight’s map view and culture data. Whether you’re working with simple image files or attribute filled shape files, it’s easy build a exciting presentation with Insight.
|
|

|
Build a 3D horizon from 2D data
When working on a new area, we often have libraries of 2D data to draw from. When building regional models, we need to extend this interpretation spatially. Find out how easy it is to translate your 2D horizon to a 3D XY horizon.
|
|

|
Display horizon attributes and structure in 3D
Easily create dramatic 3D displays of horizon properties in a few clicks! Display horizon properties taken from amplitude extractions or other horizon calculations to reveal depositional detail, structural complexity, or thickness variation over a structure.
|
|

|
Closed Contours
Looking for more information on that structural high? Using DUG Insight's contours and polygons, you can quickly generate useful boundaries and volumetrics. Find out how in this quick video.
|
|

|
Displaying Contours
Take a look at how to easily highlight surface structure with DUG Insight’s contouring tools. Our contours aren’t limited to time or depth values. Find out how our on-the-fly contours highlight values extracted from any volume and surface. Spectacular!
|
|
|
Spectral Decomposition part 1: Process and Display Results
Discover the secrets your dataset holds by exploring DUG-Insight’s on-the-fly Spectral Decomposition process.
Use this powerful tool to help highlight thin-bed geology, account for the depositional environment and use
Insight’s multiple views to get the best, most accurate visualization of your results!
|
|

|
Spectral Decomposition part 2: Analysing Tuning cube to determine dominant frequencies
Explore DUG-Insight’s specialised Spectral Decomposition views in part 2 of our Spectral Decomposition
series. Learn how to analyse your tuning cube to determine the dominant frequencies!
|
|

|
Horizon Unconformity patterns
Transform a smooth horizon to a wavy horizon using horizon maths. This horizon manipulation is handy to highlight unconformities for screenshots and presentations.
|
|

