Using Multiple Well Crossplots
Cross-plotting curves from wells can identify relationships in well data.
Tip: The cursor is linked between well views and well crossplots. When moving the cursor in a well view, the crossplot cursor moves to the corresponding crossplot coordinates.
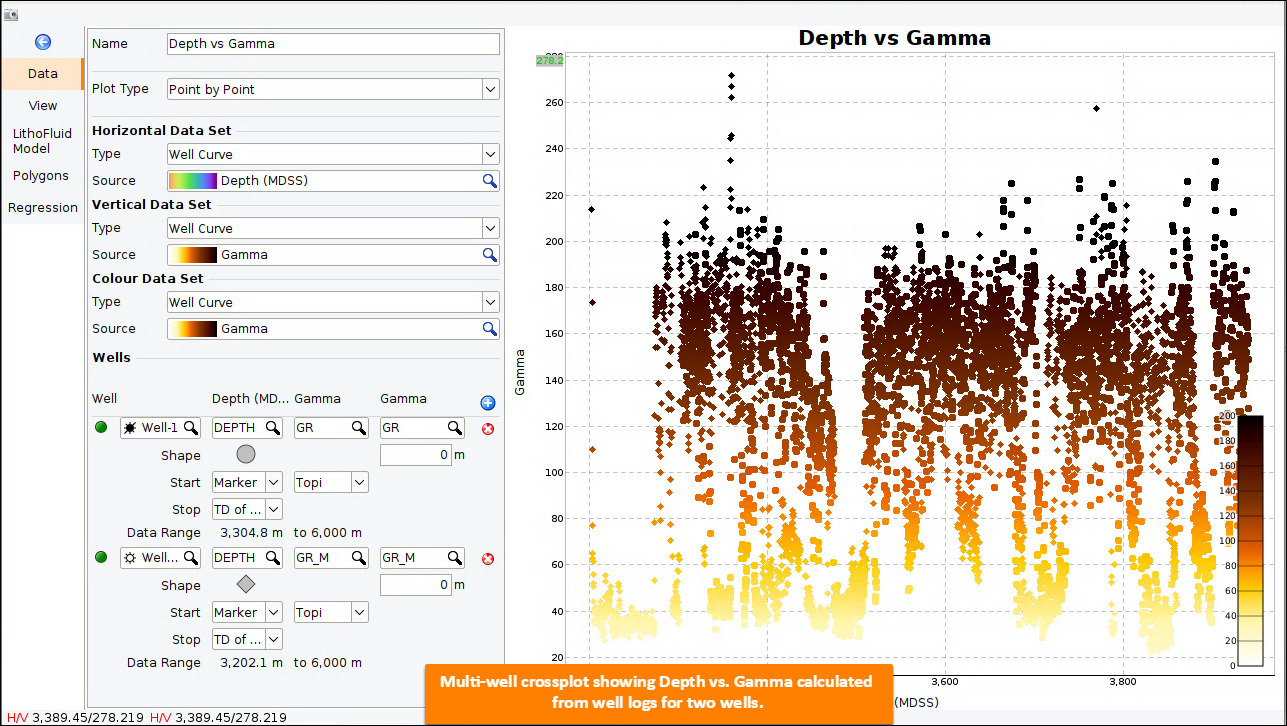
Note: Well curves can only be crossplotted against other well curves. Contact support@dug.com to express your interest in crossplotting wells against other data.
Creating the crossplot
- Open an existing crossplot or create a new one.
- Open the Data tab.
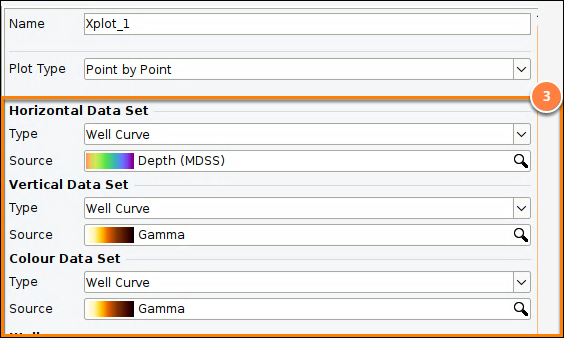
- Configure the Horizontal and Vertical Data Sets:
- Data Type: Well Curve
- Data Source: Choose the curve class for each axis. Alongside any curves loaded on the well, built-in runtime depth curves are available: MD (from well path), TVDSS (from well path), TVDBML (from well path), TVDSS (from MD), and TVDBML (from MD). The (from MD) curves are generated per curveset with a visible depth (MD) curve and follow its sampling rate; the (from well path) curves use the (typically coarser) well path sampling instead
Colour Data Set (for Point-by-Point plot types): Select the Data Type and Data Source to use for colour values.
Adding and configuring wells
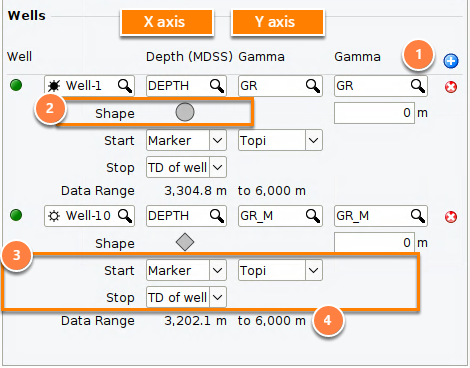
- In the Wells section, click the blue + icon to add a well.
- Green/yellow circle: Include/exclude values from a well
- Well column: Select the well
- X axis: Select the horizontal curve for this well
- Y axis: Select the vertical curve for this well
- Red x: Remove well
-
Shape: Click and select the shape of the points for each well.
- Set Start and Stop to choose an interval to crossplot
- Start and Stop locations:
- Top of Well: The shallowest well position
- TD of Well: The deepest well position
- Depth: A single depth value (MDKB, TVDSS, TVDBML)
- Horizon: Choose a horizon (with optional offset)
- Marker: Choose a marker (with optional offset)
- Data Range: The interval used to select values is shown in MD.
Note: Yellow highlight indicates the setting is incomplete, make sure the value is complete or valid.
Colouring points by another curve
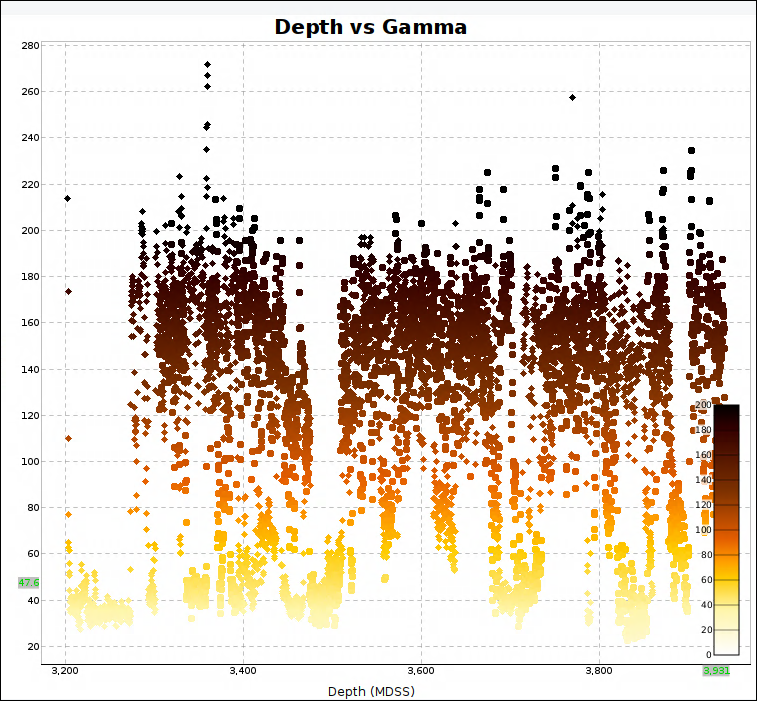
When crossplotting wells, use a third curve to colour the points.
-
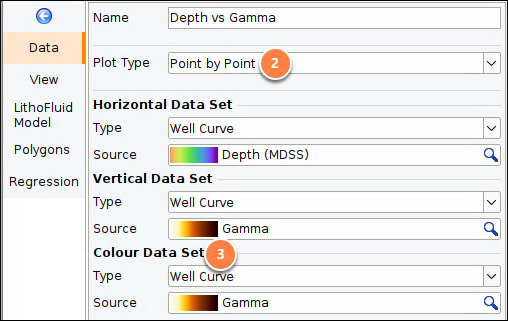
Go to the Data tab.
-
Set Plot Type to Point by Point.
-
In the Colour Data Set section, configure the following:
-
Data Type: Select Well Curve.
-
Data Source: Click and choose the curve class to use to colour the points.
-
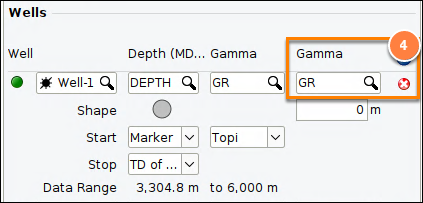
- At each well, a third curve selector is added to the wells.
Colouring points by well
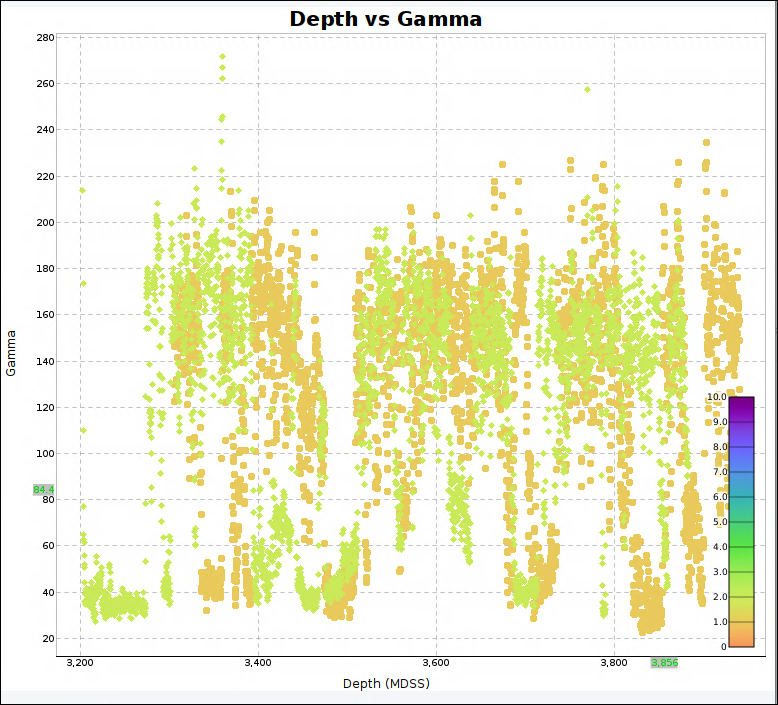
When crossplotting wells, use Well ID to identify the source of data points.
-
Go to the Data tab.
-
Set Plot Type to Point by Point.
-
In the Colour Data Set section, configure the following:
-
Data Type: Select Well Curve.
-
Data Source: Click and select ID Number.
-
-
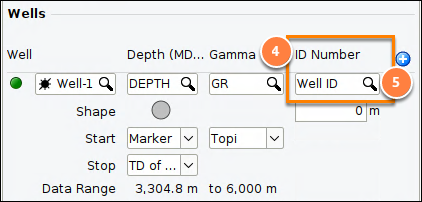
At each well, a third curve selector is added.
-
Select the curve Well ID.
Tip: Well ID can also be used for horizontal and vertical axis data.