Crossplots (Overview)
Crossplots display the relationship between two datasets via colour-coded scatter plots.
Crossplots are listed in the Control Panel/Crossplot tab as well as in the View menu under Crossplots. To show the crossplot window, double-click a crossplot in the tree or right-click and select Open crossplot window.
If you have a rock physics litho-fluid model created using DUG Rock or provided by DUG, you can identify areas corresponding to lithology and fluid probability distribution functions (PDFs).
Crossplots require at least two data sets. Supported data types include volumes, horizons, well curves and vertical dimensions (time/depth).
Creating a crossplot
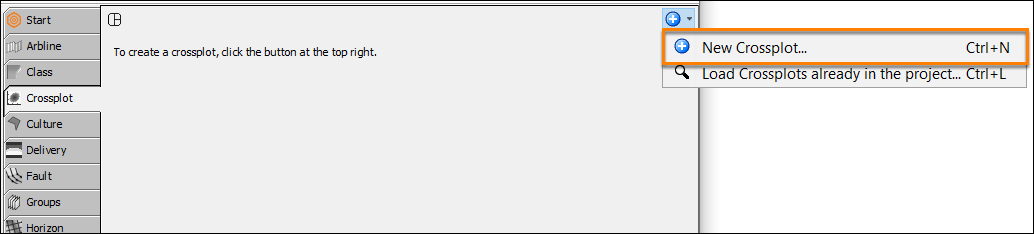
- In the Control Panel, open the Crossplot tab.
- At the tab header, click the blue “+” icon.
- Click New crossplot. A new crossplot window will be displayed.
Sharing Crossplots between Sessions
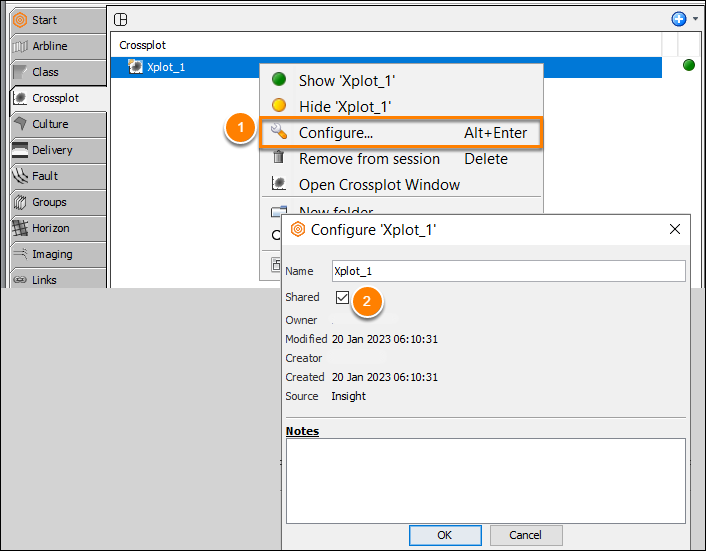
Crossplots are saved in the project and can be shared with other users and sessions.
- In the Crossplot tab, right-click a crossplot and select Configure.
- Select the Shared check-box, and click OK.
Loading an Existing Crossplot into a Session
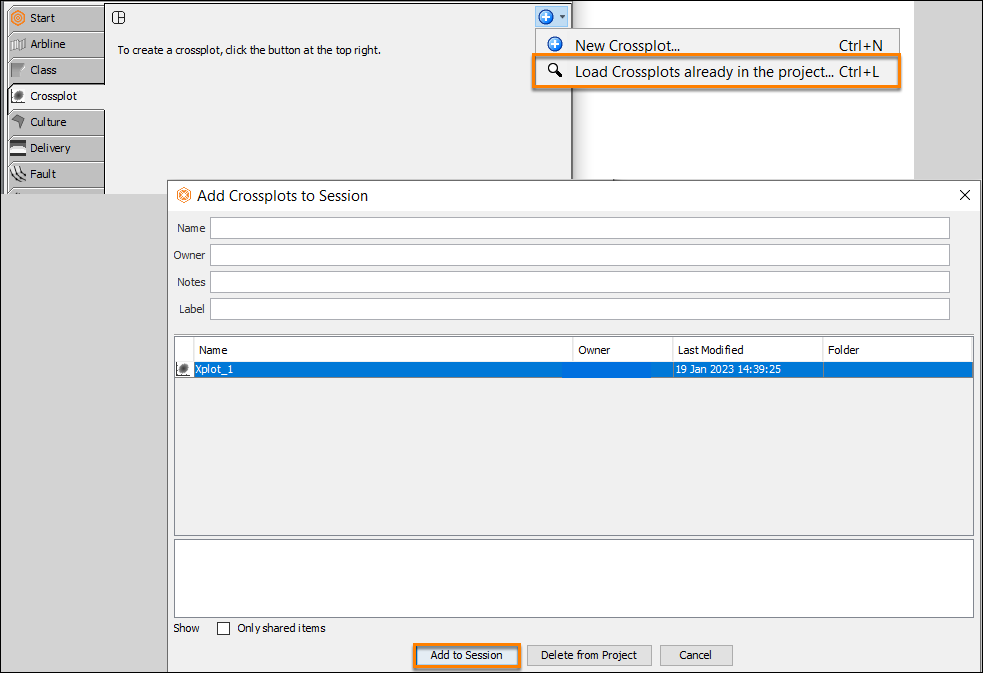
Crossplots saved in a previous session are saved in the project and can be accessed in another session.
- Start a new Session. For more information, refer to Using and Managing Sessions.
- In the Crossplot tab, click the + icon at the top right and select Load Crossplots already in the project.
- All the crossplots that have been saved in the project database will be displayed in this window. By default, the search dialog will show all items owned by everyone, shared or not. To only show items that are owned by you, or items marked as shared, select the Only shared items check-box at the bottom left of the window (see Multi-user Considerations).
- If there are many items in the project database, you can quickly search for the desired items. Typing in the Name, Owner, Notes and/or Label boxes will limit the display to items that match the texts. In the table that displays the search results, select an item or multiple items that you want to add to the session.
- Click the Add to Session button to add the selected item(s) to the current session.
Status bar
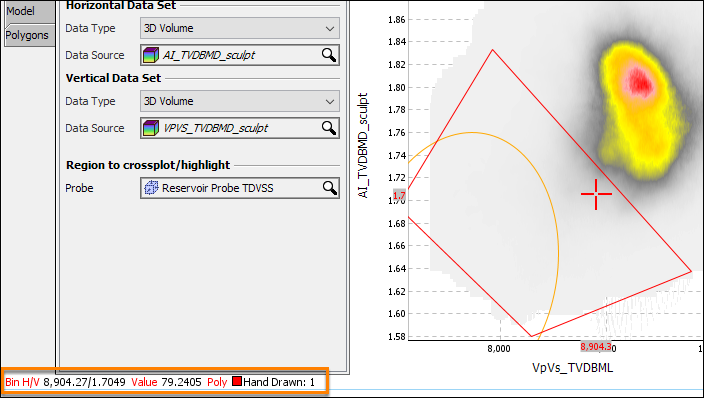
The crossplot cursor is linked to other Insight views. When moving the cursor in another view, the crossplot cursor moves to the corresponding value (if the corresponding value is inside the crossplot domain).
The crossplot cursor provides additional information in the status bar.
- Binned Crossplots
- Bin H/V: The horizontal and vertical centre of the current bin
- Value: The number of points in the bin
- Point-by-point crossplot:
- H/V: The horizontal and vertical value
- Polygon:
- The name of crossplot polygons that include this point