Spectra Analysis Overview
Use Insight’s Spectra Analysis to view and compare the spectra of volumes and wavelets. Results can include signal and noise spectra as well as time, frequency and phase plots for wavelets.
Using the Spectra Analyser
In Control Panel, go to Tool > Spectra Analysis to open the Spectra Analysis view.
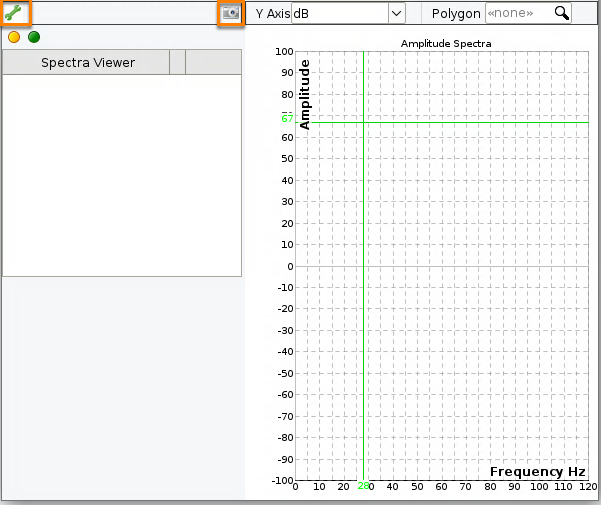
To add data to the Spectra Analysis window, see Adding Data Sets.
Spectral analysis supports wavelets, 2D, 3D and gather volumes. Additional settings are required when analysing gathers (see Adding Gather Volume).
Add volumes and wavelets to the view by dragging them from the Control Panel, or right-clicking and choosing “Send to Spectra Analyser”.
Select an entry in the left panel to show its settings.
The toolbar includes:
- Tool icon: Open the Spectra View Settings
- Camera icon: Take a screen capture (see Taking Screen Captures).
Viewing Spectra
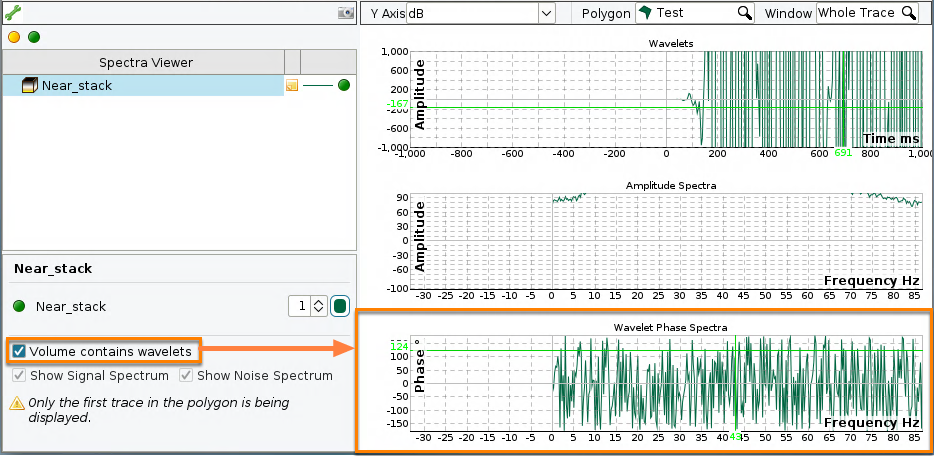
Amplitude spectra are plotted in the right panel.
The data to analyse is defined in the toolbar by selecting a polygon. If a map polygon is chosen, optionally specify the window (vertical interval) by choosing a layer from a window model (seeCreating a Polygon and Creating a Windowing Model).
If a wavelet is selected, additional amplitude and phase plots are included. These can be disabled if not required.
Additional configuration settings are available by clicking the tool icon (see Defining Spectra View Settings).
To display Signal and Noise spectra, see Signal and Noise Estimates.
Selecting data to analyse
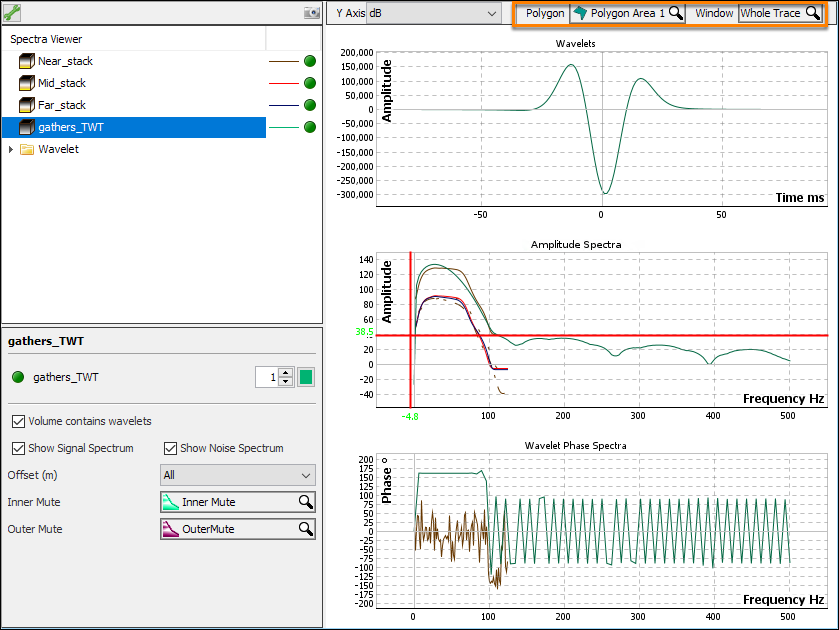
The selected polygon defines the sampling area:
- For polygons created in section views (IL/CL, 2D, Arbline, etc.) the samples inside the polygon are used.
- For polygons created in the Map View, analysis is performed on the whole trace or the specified layer of a windowing model.
Tip: To hide the Wavelet Amplitude and Wavelet Phase charts, right-click a plot and click Hide wavelet panels.
Note: Configure the axis type of the display by right clicking anywhere in the plot and selecting Configure Track.